How Stringent Donor Criteria Can Shrink Blood Product Access
Prepared by:
Zachry Vavra, Versiti Manager Quality Assurance; Olivier LaPuente, Versiti Professional Quality Assurance
Key highlights:
- Stringent donor selection requirements drastically reduce the donor pool.
- The compounded effects of donor select requirements reveal the critical need for careful consideration to balance precision with practical feasibility.
Executive Summary:
In biomedical research, stringent eligibility criteria for contributors of blood products and biospecimens are often necessary to ensure the precision and efficacy of studies. What often is not considered, however, is the impact of donor selection criteria on overall product availability.
By examining two specific case study examples, we gain insights into the challenges and implications of matching contributors to study requirements, highlighting the complexities and significant reductions in eligible donor pools.
Understanding the impacts of inclusion/exclusion criteria on donor pool eligibility can help you set more feasible criteria without compromising scientific rigor.
When seeking biospecimens for research purpose, it is important to consider donor eligibility criteria. These inclusion and exclusionary variables help to ensure precision, consistency, and efficacy of studies.
Defining Common Eligibility Criteria
Eligibility criteria for studies can vary significantly, however there are several common requirements shared by most studies. These requirements typically fall into basic categories: race, age, sex, body mass index (BMI), Human Leukocyte Antigen (HLA) type, and special infectious disease considerations such as Human Cytomegalovirus (CMV) status.
Race. Race-based criteria may involve the exclusion of a particular race, the inclusion of a single race, or a group of races.
Sex. When sex is specified, the requirement will always be for either females or males.
Age. Age requirements are usually expressed as a range or a specific age group.
BMI. Like age, BMI is specified as a range.
HLA Typing. Due to their crucial role in disease defense, HLA typing is a frequently requested criterion. It is often a group of alleles within a specific major or minor class or a single allele.
CMV Status. Often, studies require criteria that do not fall within the previously mentioned categories, such as CMV status.
In the case studies below, we will explore how enhanced eligibility criteria impact the potential donor pool.
Case Study 1
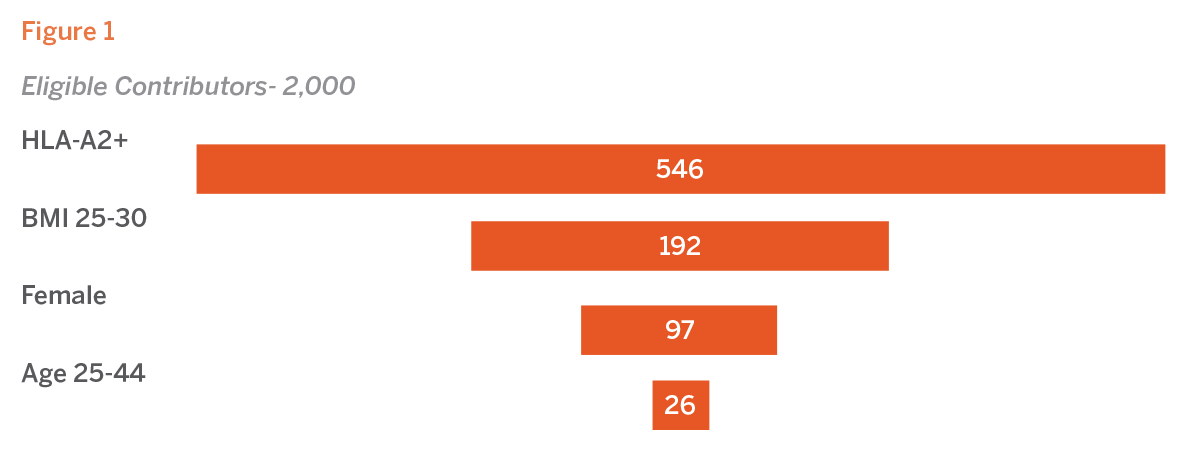
In this initial case, researchers aimed to identify a suitable donor who meets four specific criteria:
- HLA-A2 positive
- BMI between 25 and 30
- Female
- Age range of 25 to 44 years
Overlaying US-population data, we understand that HLA-A2 alleles are present in approximately 27.3% of the U.S. population. Within a repository of 2,000 recallable contributors, this would result in an initial pool of 546 potential donors. Considering that 35.1% of the U.S. population aged 25-44 has a BMI between 25 and 30, the eligible pool would further reduce to 192 individuals. Given that females constitute about half of the U.S. population, this pool would decrease to 97 potential donors. Additionally, since only 13.2% ofwomen in the U.S. fall within the 25 to 44 age range, the number of possible contributors would decline to 26.
Although the application of multiple eligibility criteria is a common practice, the combined effect of these requirements significantly narrows the pool of eligible contributors. In this case, the representative pool from a U.S. population-based bank is reduced by 98.7%, highlighting the substantial impact of stringent donor selection criteria (see Figure 1).
Case Study 2
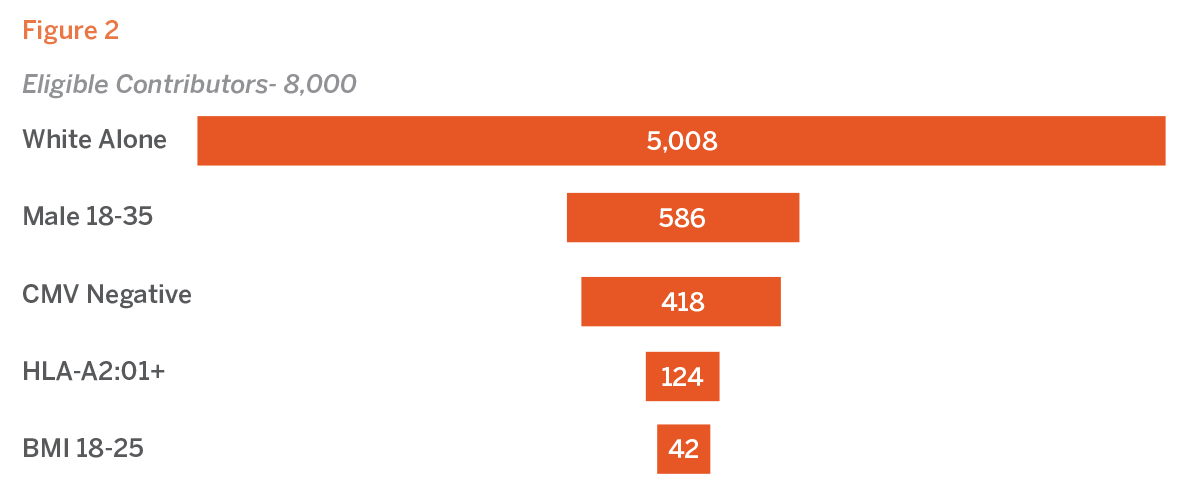
The second case seeks to fulfill six distinct criteria. The donor must be:
- White
- Male
- Age range of 18 to 35 years
- CMV negative
- HLA-A2:01 positive
- BMI between 18 and 25
Within the U.S., 62.6% of the population identifies as white. For a donor bank with 8,000 recallable contributors, this demographic requirement equates to 5,008 individuals. Males ages 18 to 35 comprise 11.7% of the U.S. population, which further narrows the pool to 586 eligible contributors. The seroprevalence of CMV among white males ages 20 to 39 in the U.S. is approximately 28.7%, reducing the pool to 418 potential donors. The HLA-A2:01 allele is found in 29.6% of the white population, further decreasing the number of eligible contributors to 124 individuals. Finally, 34% of the white population has a BMI between 18 and 25, resulting in apool of just 42 eligible contributors.
The compounded effect of these specific criteria leads to a drastic reduction in the number of eligible donors. From an initial pool representative of the U.S. population, the pool is reduced by 99.5%, underscoring the significant impact of stringent donor selection criteria (see Figure 2).
Having a partner that has an opt-in, recallable, diverse donor bank that spans geography helps to mitigate any homogenous demographics. It is critical to evaluate and prioritize donor criteria with your blood supplier before finalizing study protocols to ensure your study moves forward.
Summary
The detailed analysis of donor selection criteria underscores the significant challenges faced in blood banks for biomedical research. Through the case study examples, it becomes evident that stringent eligibility requirements drastically narrow the pool of potential donors.
For instance, the first case study’s criteria reduce the eligible contributors by 98.7%, while the second case study highlights a 99.5% reduction. The comprehensive overview of eligibility requirements further illustrates the multifaceted nature of donor selection, emphasizing race, sex, age, BMI, HLA typing, and CMV status as pivotal factors.
Ultimately, the compounded effects of these criteria reveal the critical need for careful consideration in donor requirements to balance precision with practical feasibility.
Consider the following:
- Evaluate criteria early with your blood supplier.
- Prioritize essential versus nice-to-have traits. Consider working with donor banks that can prescreen or enrich for specific attributes such as HLA typing, CMV status, etc.
- Request a feasibility assessment before finalizing study protocols.
- Identify a partner with a diverse donor pool, and potential geographic diversity if possible.
Donor precision is critical-but balancing it with supply feasibility ensures your study gets off the ground.
Appendix A
HLA Class I-A alleles frequency in US population by race and ethnicity
| A | European Frequency | African Frequency | Asian Pacific Frequency | Hispanic Frequency |
|---|---|---|---|---|
| 0101g | 17.18% | 4.74% | 5.08% | 6.70% |
| 0102 | 0.01% | 0.65% | 0.00% | 0.30% |
| 0103 | 0.01% | 0.02% | 0.00% | 0.00% |
| 0116N | 0.01% | 0.00% | 0.00% | 0.00% |
| 0201g | 29.60% | 12.46% | 9.46% | 19.40% |
| 0202 | 0.08% | 4.20% | 0.03% | 0.68% |
| 0203 | 0.00% | 0.02% | 3.16% | 0.03% |
| 0204 | 0.00% | 0.02% | 0.00% | 0.28% |
| 0205 | 0.80% | 1.87% | 0.34% | 1.48% |
| 0206 | 0.20% | 0.02% | 4.83% | 3.92% |
| 0207g | 0.00% | 0.00% | 4.38% | 0.00% |
| 0210 | 0.00% | 0.00% | 0.09% | 0.00% |
| 0211g | 0.00% | 0.02% | 1.16% | 0.33% |
| 0212 | 0.00% | 0.00% | 0.00% | 0.03% |
| 0213 | 0.01% | 0.02% | 0.00% | 0.08% |
| 0214 | 0.00% | 0.02% | 0.00% | 0.00% |
| 0216 | 0.00% | 0.00% | 0.11% | 0.00% |
| 0217 | 0.05% | 0.00% | 0.00% | 0.35% |
| 0219 | 0.01% | 0.00% | 0.00% | 0.00% |
| 0220 | 0.01% | 0.02% | 0.06% | 0.15% |
| 0222 | 0.00% | 0.02% | 0.00% | 0.20% |
| 0224 | 0.02% | 0.00% | 0.00% | 0.00% |
| 0230 | 0.02% | 0.00% | 0.00% | 0.03% |
| 0242 | 0.00% | 0.00% | 0.03% | 0.00% |
| 0253N | 0.00% | 0.00% | 0.03% | 0.00% |
| 0260 | 0.00% | 0.06% | 0.00% | 0.03% |
| 0274 | 0.00% | 0.02% | 0.00% | 0.00% |
| 0301g | 14.35% | 8.13% | 2.60% | 7.91% |
| 0302 | 0.28% | 0.08% | 0.54% | 0.18% |
| 0305 | 0.01% | 0.00% | 0.00% | 0.00% |
| 0307 | 0.00% | 0.00% | 0.00% | 0.00% |
| 1101g | 5.64% | 1.58% | 17.90% | 4.62% |
| 1102 | 0.18% | 0.00% | 1.53% | 0.00% |
| 1103 | 0.01% | 0.00% | 0.03% | 0.00% |
| 1104 | 0.03% | 0.00% | 0.00% | 0.03% |
| 1105 | 0.01% | 0.00% | 0.00% | 0.00% |
| 1119 | 0.00% | 0.00% | 0.03% | 0.00% |
| A | European Frequency | African Frequency | Asian Pacific Frequency | Hispanic Frequency |
|---|---|---|---|---|
| 2301g | 1.68% | 10.77% | 0.23% | 3.69% |
| 2305 | 0.00% | 0.02% | 0.00% | 0.03% |
| 2402g | 8.69% | 2.21% | 18.24% | 12.32% |
| 2403g | 0.11% | 0.04% | 0.57% | 0.20% |
| 2405 | 0.00% | 0.00% | 0.00% | 0.05% |
| 2407 | 0.01% | 0.08% | 1.78% | 0.05% |
| 2408 | 0.00% | 0.00% | 0.06% | 0.00% |
| 2410 | 0.00% | 0.00% | 0.25% | 0.00% |
| 2414 | 0.00% | 0.00% | 0.00% | 0.03% |
| 2417 | 0.00% | 0.04% | 0.42% | 0.00% |
| 2420 | 0.00% | 0.00% | 0.17% | 0.00% |
| 2422 | 0.00% | 0.00% | 0.00% | 0.13% |
| 2425 | 0.00% | 0.00% | 0.00% | 0.25% |
| 2426 | 0.01% | 0.00% | 0.00% | 0.08% |
| 2458 | 0.01% | 0.00% | 0.00% | 0.00% |
| 2501 | 1.93% | 0.50% | 0.06% | 0.88% |
| 2502 | 0.01% | 0.00% | 0.00% | 0.00% |
| 2601g | 2.95% | 1.41% | 3.90% | 2.89% |
| 2602 | 0.00% | 0.00% | 0.73% | 0.03% |
| 2603 | 0.00% | 0.02% | 0.14% | 0.00% |
| 2607 | 0.00% | 0.00% | 0.00% | 0.03% |
| 2608 | 0.04% | 0.04% | 0.00% | 0.10% |
| 2609 | 0.01% | 0.00% | 0.00% | 0.00% |
| 2612 | 0.00% | 0.04% | 0.00% | 0.00% |
| 2901g | 0.22% | 0.10% | 1.44% | 0.35% |
| 2902 | 3.28% | 3.64% | 0.14% | 4.17% |
| 3001 | 1.34% | 6.91% | 2.06% | 2.11% |
| 3002 | 0.92% | 6.22% | 0.06% | 2.81% |
| 3004 | 0.07% | 0.21% | 0.34% | 0.25% |
| 3010 | 0.00% | 0.00% | 0.00% | 0.15% |
| 3101 | 2.35% | 1.04% | 3.25% | 4.79% |
| 3102 | 0.01% | 0.00% | 0.00% | 0.15% |
| 3104 | 0.00% | 0.02% | 0.00% | 0.00% |
| 3109 | 0.00% | 0.00% | 0.00% | 0.03% |
| 3112 | 0.00% | 0.00% | 0.03% | 0.00% |
| 3201 | 3.13% | 1.41% | 1.30% | 2.71% |
| 3206 | 0.00% | 0.00% | 0.00% | 0.03% |
| 3301 | 0.99% | 2.12% | 0.11% | 1.96% |
| 3303 | 0.13% | 4.45% | 9.43% | 1.31% |
| 3305 | 0.03% | 0.00% | 0.00% | 0.00% |
| 3401 | 0.00% | 0.04% | 1.58% | 0.03% |
| 3402 | 0.04% | 3.35% | 0.03% | 0.33% |
A | European Frequency | African Frequency | Asian Pacific Frequency | Hispanic Frequency |
3403 | 0.00% | 0.02% | 0.00% | 0.00% |
3405 | 0.00% | 0.00% | 0.14% | 0.00% |
3601 | 0.01% | 2.41% | 0.00% | 0.28% |
3603 | 0.00% | 0.02% | 0.00% | 0.00% |
4301 | 0.00% | 0.02% | 0.00% | 0.00% |
6601 | 0.26% | 1.48% | 0.03% | 0.55% |
6602 | 0.00% | 0.79% | 0.00% | 0.10% |
6603 | 0.00% | 0.23% | 0.00% | 0.00% |
6801g | 2.50% | 3.68% | 1.86% | 4.69% |
6802 | 0.85% | 6.51% | 0.03% | 2.46% |
6803 | 0.01% | 0.00% | 0.03% | 1.38% |
6805 | 0.00% | 0.02% | 0.00% | 0.35% |
6807 | 0.00% | 0.00% | 0.00% | 0.03% |
6815 | 0.00% | 0.02% | 0.00% | 0.00% |
6825 | 0.01% | 0.00% | 0.00% | 0.00% |
6901 | 0.08% | 0.04% | 0.14% | 0.55% |
7401g | 0.01% | 5.22% | 0.11% | 0.75% |
7403 | 0.02% | 0.02% | 0.00% | 0.00% |
7409 | 0.00% | 0.06% | 0.00% | 0.00% |
7411 | 0.00% | 0.06% | 0.00% | 0.00% |
8001 | 0.00% | 0.71% | 0.00% | 0.25% |
Source: Maiers, M., Gragert, L., Klitz, W. High resolution HLA alleles and haplotypes in the US population. Human Immunology (2007) 68, 779-788.
https://pubmed.ncbi.nlm.nih.gov/17869653/
Appendix B
US population by age and sex
| Total | Percent | Male | Percent Male | Female | Percent Female |
| Total population | 333,287,562 | 100.0% | 165,228,214 | 49.6% | 168,059,348 | 50.4% |
| Under 5 years | 18,358,199 | 5.50% | 9,394,890 | 5.70% | 8,963,309 | 5.30% |
| 5 to 9 years | 19,770,314 | 5.90% | 10,110,917 | 6.10% | 9,659,397 | 5.70% |
| 10 to 14 years | 21,220,214 | 6.40% | 10,892,415 | 6.60% | 10,327,799 | 6.10% |
| 15 to 19 years | 21,785,658 | 6.50% | 11,167,522 | 6.80% | 10,618,136 | 6.30% |
| 20 to 24 years | 22,446,040 | 6.70% | 11,488,577 | 7.00% | 10,957,463 | 6.50% |
| 25 to 29 years | 22,007,628 | 6.60% | 11,245,260 | 6.80% | 10,762,368 | 6.40% |
| 30 to 34 years | 23,225,636 | 7.00% | 11,785,090 | 7.10% | 11,440,546 | 6.80% |
| 35 to 39 years | 22,335,859 | 6.70% | 11,322,522 | 6.90% | 11,013,337 | 6.60% |
| Total | Percent | Male | Percent Male | Female | Percent Female |
| 40 to 44 years | 21,711,785 | 6.50% | 10,939,843 | 6.60% | 10,771,942 | 6.40% |
| 45 to 49 years | 19,640,925 | 5.90% | 9,853,198 | 6.00% | 9,787,727 | 5.80% |
| 50 to 54 years | 20,835,521 | 6.30% | 10,447,394 | 6.30% | 10,388,127 | 6.20% |
| 55 to 59 years | 20,553,615 | 6.20% | 10,163,454 | 6.20% | 10,390,161 | 6.20% |
| 60 to 64 years | 21,573,853 | 6.50% | 10,492,488 | 6.40% | 11,081,365 | 6.60% |
| 65 to 69 years | 18,559,497 | 5.60% | 8,798,968 | 5.30% | 9,760,529 | 5.80% |
| 70 to 74 years | 15,338,575 | 4.60% | 7,149,850 | 4.30% | 8,188,725 | 4.90% |
| 75 to 79 years | 11,005,461 | 3.30% | 4,901,587 | 3.00% | 6,103,874 | 3.60% |
| 80 to 84 years | 6,758,839 | 2.00% | 2,861,152 | 1.70% | 3,897,687 | 2.30% |
| 85 years and over | 6,159,943 | 1.80% | 2,213,087 | 1.30% | 3,946,856 | 2.30% |
US population by selected age categories
| Total | Percent | Male | Percent Male | Female | Percent Female |
| 5 to 14 years | 40,990,528 | 12.3 | 21,003,332 | 12.7 | 19,987,196 | 11.9 |
| 15 to 17 years | 12,976,875 | 3.9 | 6,655,455 | 4 | 6,321,420 | 3.8 |
| Under 18 years | 72,325,602 | 21.7 | 37,053,677 | 22.4 | 35,271,925 | 21 |
| 18 to 24 years | 31,254,823 | 9.4 | 16,000,644 | 9.7 | 15,254,179 | 9.1 |
| 15 to 44 years | 133,512,606 | 40.1 | 67,948,814 | 41.1 | 65,563,792 | 39 |
| 16 years and over | 269,555,318 | 80.9 | 132,607,016 | 80.3 | 136,948,302 | 81.5 |
| 18 years and over | 260,961,960 | 78.3 | 128,174,537 | 77.6 | 132,787,423 | 79 |
| 21 years and over | 247,659,649 | 74.3 | 121,344,241 | 73.4 | 126,315,408 | 75.2 |
| 60 years and over | 79,396,168 | 23.8 | 36,417,132 | 22 | 42,979,036 | 25.6 |
| 62 years and over | 70,685,247 | 21.2 | 32,135,422 | 19.4 | 38,549,825 | 22.9 |
| 65 years and over | 57,822,315 | 17.3 | 25,924,644 | 15.7 | 31,897,671 | 19 |
| 75 years and over | 23,924,243 | 7.2 | 9,975,826 | 6 | 13,948,417 | 8.3 |
Source: US Census 2022 American Community Survey 1-Year Estimates
Appendix C
US population by race
Total: | 331,449,281 | |
Population of one race: | 297,600,338 | 89.79% |
White alone | 204,277,273 | 61.63% |
Black or African American alone | 41,1042,00 | 12.40% |
American Indian and Alaska Native alone | 3,727,135 | 1.12% |
Asian alone | 19,886,049 | 6.00% |
Native Hawaiian and Other Pacific Islander alone | 689,966 | 0.21% |
Source: US Census 2022 American Community Survey 1-Year Estimates
Appendix D
Body Mass Index (BMI) by age
| Age | BMI is less than 18 | BMI is greater than or equal to 18 and less than 25 | BMI is greater than or equal to 25 and less than 30 | BMI is greater than or equal to 30 and less than 40 | BMI is 40 or greater |
| Ages 20-24 | 3.10% | 52.20% | 26.10% | 15.30% | 3.40% |
| Ages 25-44 | 1.40% | 34.40% | 35.10% | 24.60% | 4.50% |
| Ages 45-64 | 0.70% | 28.00% | 37.60% | 28.50% | 5.30% |
| Age 65 and older | 2.20% | 31.10% | 39.00% | 24.40% | 3.40% |
Source: Center for Financing, Access, and Cost Trends, AHRQ, Household and Pharmacy Components of the Medical Expenditure Panel Survey, 2009
Appendix E
Cytomegalovirus Seroprevalence in the US
| Age, Total Years | Sample Size | Age-adjusted Prevalence Estimate |
| Categories | 22,639 | 58.9% |
| 6-11 | 2,679 | 36.3% |
| 12-19 | 2,918 | 41.7% |
| 20-29 | 3,302 | 49.3% |
| 30-39 | 3,156 | 54.2% |
| 40-49 | 2,483 | 64.5% |
| 50-59 | 1,800 | 74.2% |
| 60-69 | 2,257 | 83% |
| 70-79 | 1,721 | 88.8% |
| >80 | 1,323 | 90.8% |
| Sex | ||
| Male | 10,243 | 54.1% |
| Female | 11,396 | 63.5% |
| Race/Ethnicity | ||
| Non-Hispanic white | 8,212 | 51.2% |
| Non-Hispanic Black | 6,228 | 75.8% |
| Mexican American | 6,296 | 81.7% |
Source: https://doi.org/10.1086/508173
https://academic.oup.com/cid/issue/43/9
Clinical Infectious Diseases, Volume 43, Issue 9, 1 November 2006, Pages 1143–1151
Seroprevalence of Cytomegalovirus Infection in the United States, 1988–1994
Stephanie A. S. Staras, Sheila C. Dollard, Kay W. Radford,
W. Dana Flanders, Robert F. Pass, Michael J. Cannon